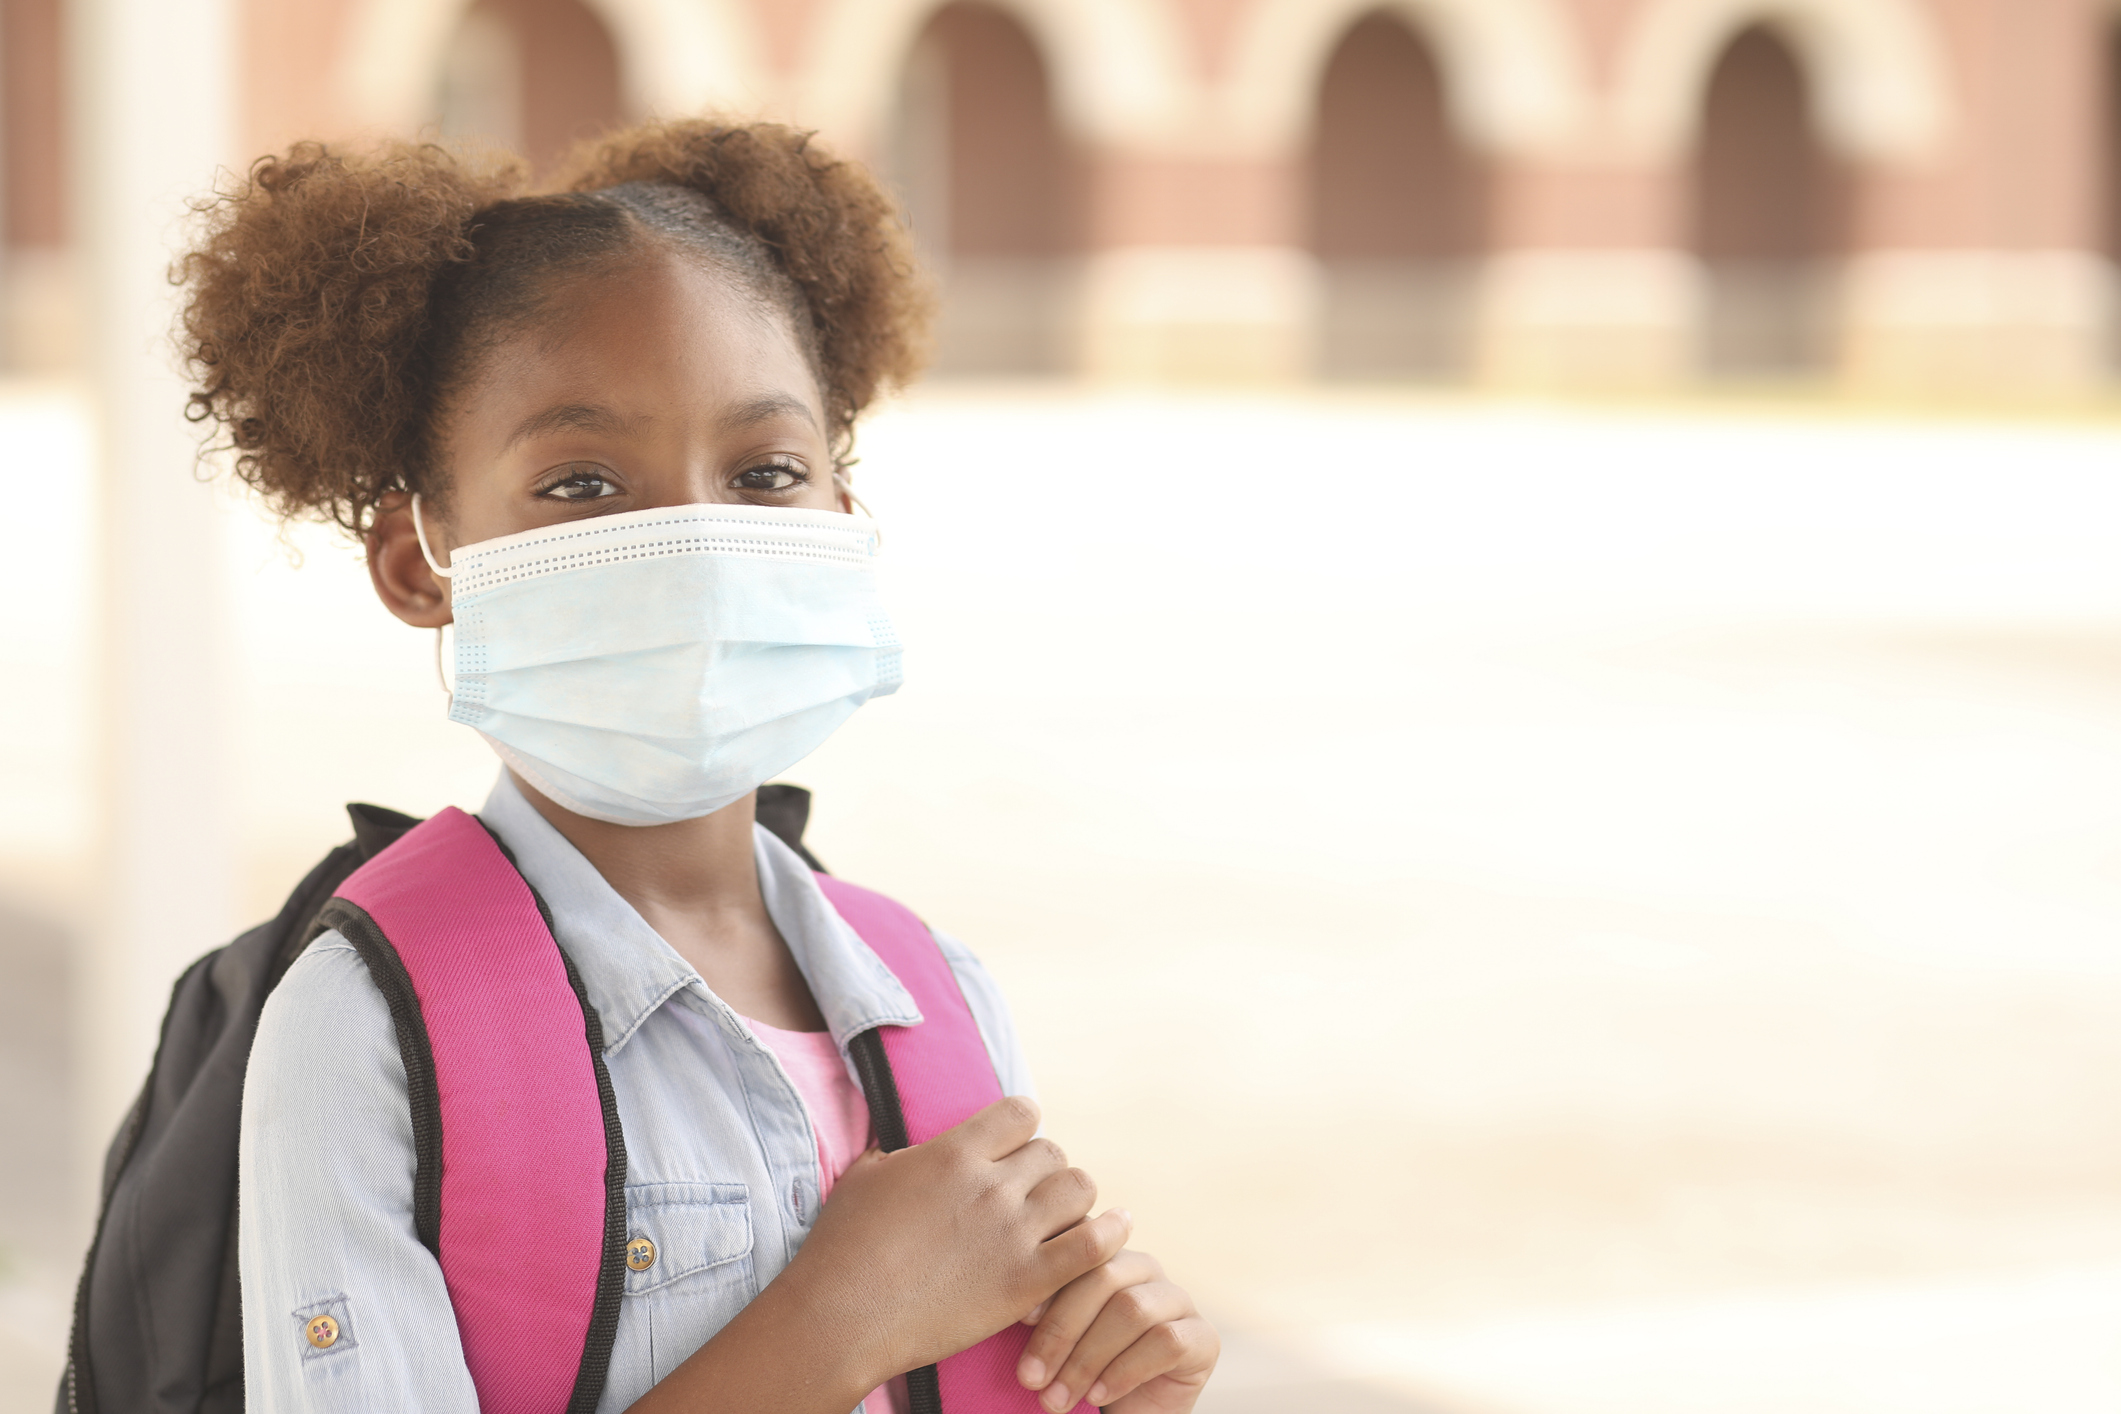
With the School District of Philadelphia returning to in-person and hybrid learning this spring, an online dashboard to track COVID-19 cases within students and staff has been launched.
More than a year has passed since the district’s schools closed in-person learning in an effort to contain the spread of the Coronavirus. Since March 2020, the district has proposed many plans of action to return to school in the last year, including hybrid learning starting for younger students in early 2021.
Currently, the district is in Phase 2 of its reopening plan, bringing students in grades 3 to 5 with complex needs back to school, and bringing students in grades 6 to 8 who selected the hybrid model for a mix of in-person and remote learning starting April 26. All staff supporting grades 3 to 8 returned to school buildings on April 12.
Although the state began vaccinating teachers last month, children have not yet been approved for receipt of the vaccine. Additionally there are some school staff that have not secured appointments or don’t choose to get the vaccine.
Built by the City’s Office of Evaluation, Research and Accountability, district spokesperson Monica Lewis said the district’s COVID-19 dashboard is designed to provide the latest information on confirmed positive cases within its schools.

The dashboard will be updated weekly, the district said, and currently shows that of the 10,337 students and staff who were tested since March, 64 were positive, for a positivity rate of 0.6%. It also includes reported tests that were performed at the school and off-site, such as a doctor’s office or community health center.
“We understand that having access to real-time information about COVID positivity rates in our schools is important for our families and community, and we are happy to provide this new tool,” Superintendent William Hite said in a statement. “As the data shows, the positivity rates in our schools are very low. We hope this helps to build further confidence in the safety of our schools as we plan to welcome more students back for in-person learning.”
The dashboard will alow a user to look at cases by school or ZIP code. It will also show how many students and staff at each school were tested in the last month. It uses the OpenStreetMap contributors tool to show interactive COVIC-19 neighborhood data.